在用python進行圖像處理時,二值化是非常重要的一步,現總結了自己遇到過的6種 圖像二值化的方法(當然這個絕對不是全部的二值化方法,若發現新的方法會繼續新增)。
相關學習推薦:python視頻教程
1. opencv 簡單閾值 cv2.threshold
2. opencv 自適應閾值 cv2.adaptiveThreshold (自適應閾值中計算閾值的方法有兩種:mean_c 和 guassian_c ,可以嘗試用下哪種效果好)
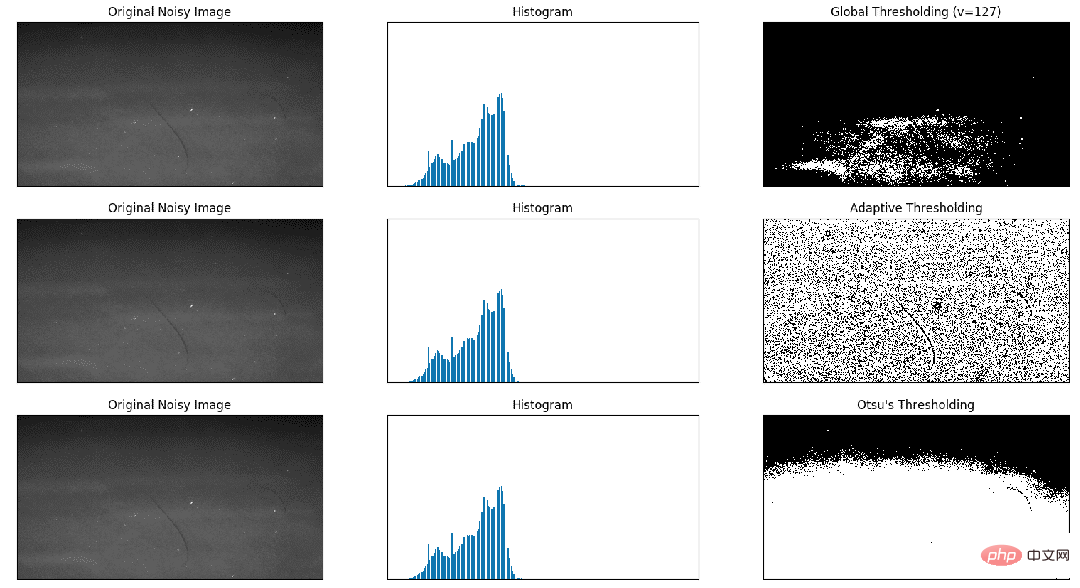
3. Otsu's 二值化
例子:
import cv2 import numpy as np from matplotlib import pyplot as plt img = cv2.imread('scratch.png', 0) # global thresholding ret1, th1 = cv2.threshold(img, 127, 255, cv2.THRESH_BINARY) # Otsu's thresholding th2 = cv2.adaptiveThreshold(img, 255, cv2.ADAPTIVE_THRESH_MEAN_C, cv2.THRESH_BINARY, 11, 2) # Otsu's thresholding # 閾值一定要設為 0 ! ret3, th3 = cv2.threshold(img, 0, 255, cv2.THRESH_BINARY + cv2.THRESH_OTSU) # plot all the images and their histograms images = [img, 0, th1, img, 0, th2, img, 0, th3] titles = [ 'Original Noisy Image', 'Histogram', 'Global Thresholding (v=127)', 'Original Noisy Image', 'Histogram', "Adaptive Thresholding", 'Original Noisy Image', 'Histogram', "Otsu's Thresholding" ] # 這里使用了 pyplot 中畫直方圖的方法, plt.hist, 要注意的是它的參數是一維數組 # 所以這里使用了( numpy ) ravel 方法,將多維數組轉換成一維,也可以使用 flatten 方法 # ndarray.flat 1-D iterator over an array. # ndarray.flatten 1-D array copy of the elements of an array in row-major order. for i in range(3): plt.subplot(3, 3, i * 3 + 1), plt.imshow(images[i * 3], 'gray') plt.title(titles[i * 3]), plt.xticks([]), plt.yticks([]) plt.subplot(3, 3, i * 3 + 2), plt.hist(images[i * 3].ravel(), 256) plt.title(titles[i * 3 + 1]), plt.xticks([]), plt.yticks([]) plt.subplot(3, 3, i * 3 + 3), plt.imshow(images[i * 3 + 2], 'gray') plt.title(titles[i * 3 + 2]), plt.xticks([]), plt.yticks([]) plt.show()
結果圖:
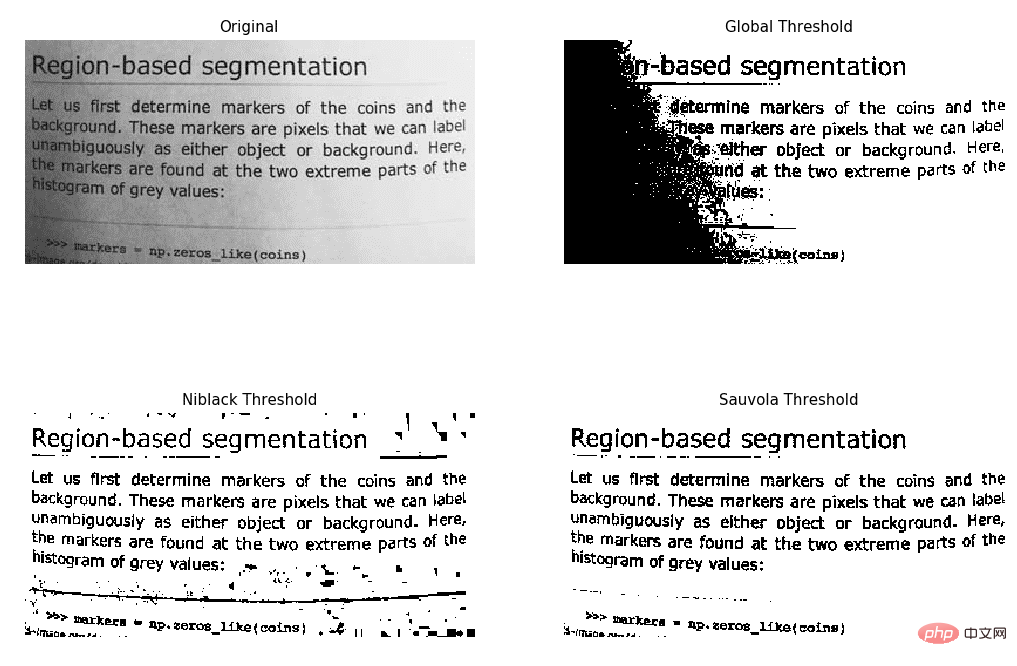
4. skimage niblack閾值
5. skimage sauvola閾值 (主要用于文本檢測)
例子:
https://scikit-image.org/docs/dev/auto_examples/segmentation/plot_niblack_sauvola.html
import matplotlib import matplotlib.pyplot as plt from skimage.data import page from skimage.filters import (threshold_otsu, threshold_niblack, threshold_sauvola) matplotlib.rcParams['font.size'] = 9 image = page() binary_global = image > threshold_otsu(image) window_size = 25 thresh_niblack = threshold_niblack(image, window_size=window_size, k=0.8) thresh_sauvola = threshold_sauvola(image, window_size=window_size) binary_niblack = image > thresh_niblack binary_sauvola = image > thresh_sauvola plt.figure(figsize=(8, 7)) plt.subplot(2, 2, 1) plt.imshow(image, cmap=plt.cm.gray) plt.title('Original') plt.axis('off') plt.subplot(2, 2, 2) plt.title('Global Threshold') plt.imshow(binary_global, cmap=plt.cm.gray) plt.axis('off') plt.subplot(2, 2, 3) plt.imshow(binary_niblack, cmap=plt.cm.gray) plt.title('Niblack Threshold') plt.axis('off') plt.subplot(2, 2, 4) plt.imshow(binary_sauvola, cmap=plt.cm.gray) plt.title('Sauvola Threshold') plt.axis('off') plt.show()
結果圖:
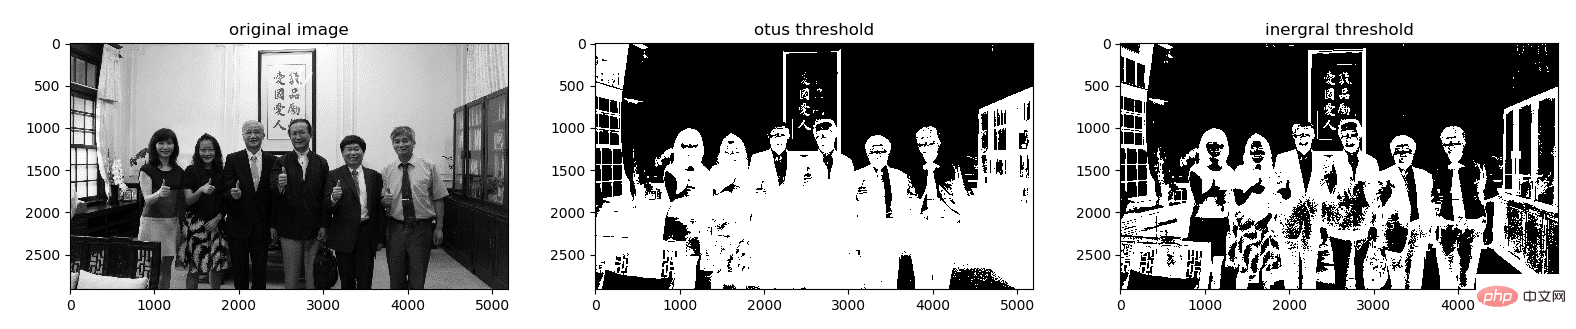
6.IntegralThreshold(主要用于文本檢測)
使用方法: 運行下面網址的util.py文件
https://github.com/Liang-yc/IntegralThreshold
結果圖: